For quite some time, I’ve been fascinated by data physicalization—collecting, visualizing, engaging with data using tactile and physical forms. This is a story of bringing hands-on data collection to a hands-on event, which maybe will inspire you to try something old-school too.
What am I even talking about? Here are some beautiful examples of data physicalization from Jon Schwabish and The Urban Institute.
We weren’t sure how people were learning about our events….
After volunteering for over a year, I recently joined the Board of The Somerville Growing Center—a green space in my neighborhood where community and plants grow. The Center is a space for local preschool children and people of all ages to learn about the natural world and urban agriculture and to simply play outdoors. I’ve loved participating in and helping to host yoga classes, concerts, and the most adorable annual camp-out for stuffed animals, among other events. Last spring, I grew sunflower plants from seeds at home, which then grew in the garden—it was so fun to watch them unfold, grow, and survive bunny snack attacks. The Growing Center is a true oasis in Somerville-the most densely populated municipality in New England, with over 80,000 people living in just 4 square miles.
In March, The Somerville Growing Center hosted its 25th annual Maple Boil Down. A team of volunteers tapped maple trees on the Tufts University (my Ph.D. alma mater) campus from January to March. Then, at the Boil Down, volunteers boiled it all down into real, true 100% hyper-local maple syrup. Kids and adults got to learn about the process, taste sap and syrup, and engage in hands-on activities.
As we planned outreach and advertising for the event, a fellow board member who was going to put up flyers wondered how effective they were, and a group of us discussed a survey that the Growing Center had used in the past to ask folks how they found out about the event. The group wondered if we might use such a survey again and which outreach categories we should ask about. I learned that at last year’s Boil Down, where they posted a survey using a QR code, they only got two responses….Always eager to learn and improve, the team was ready to try something new.
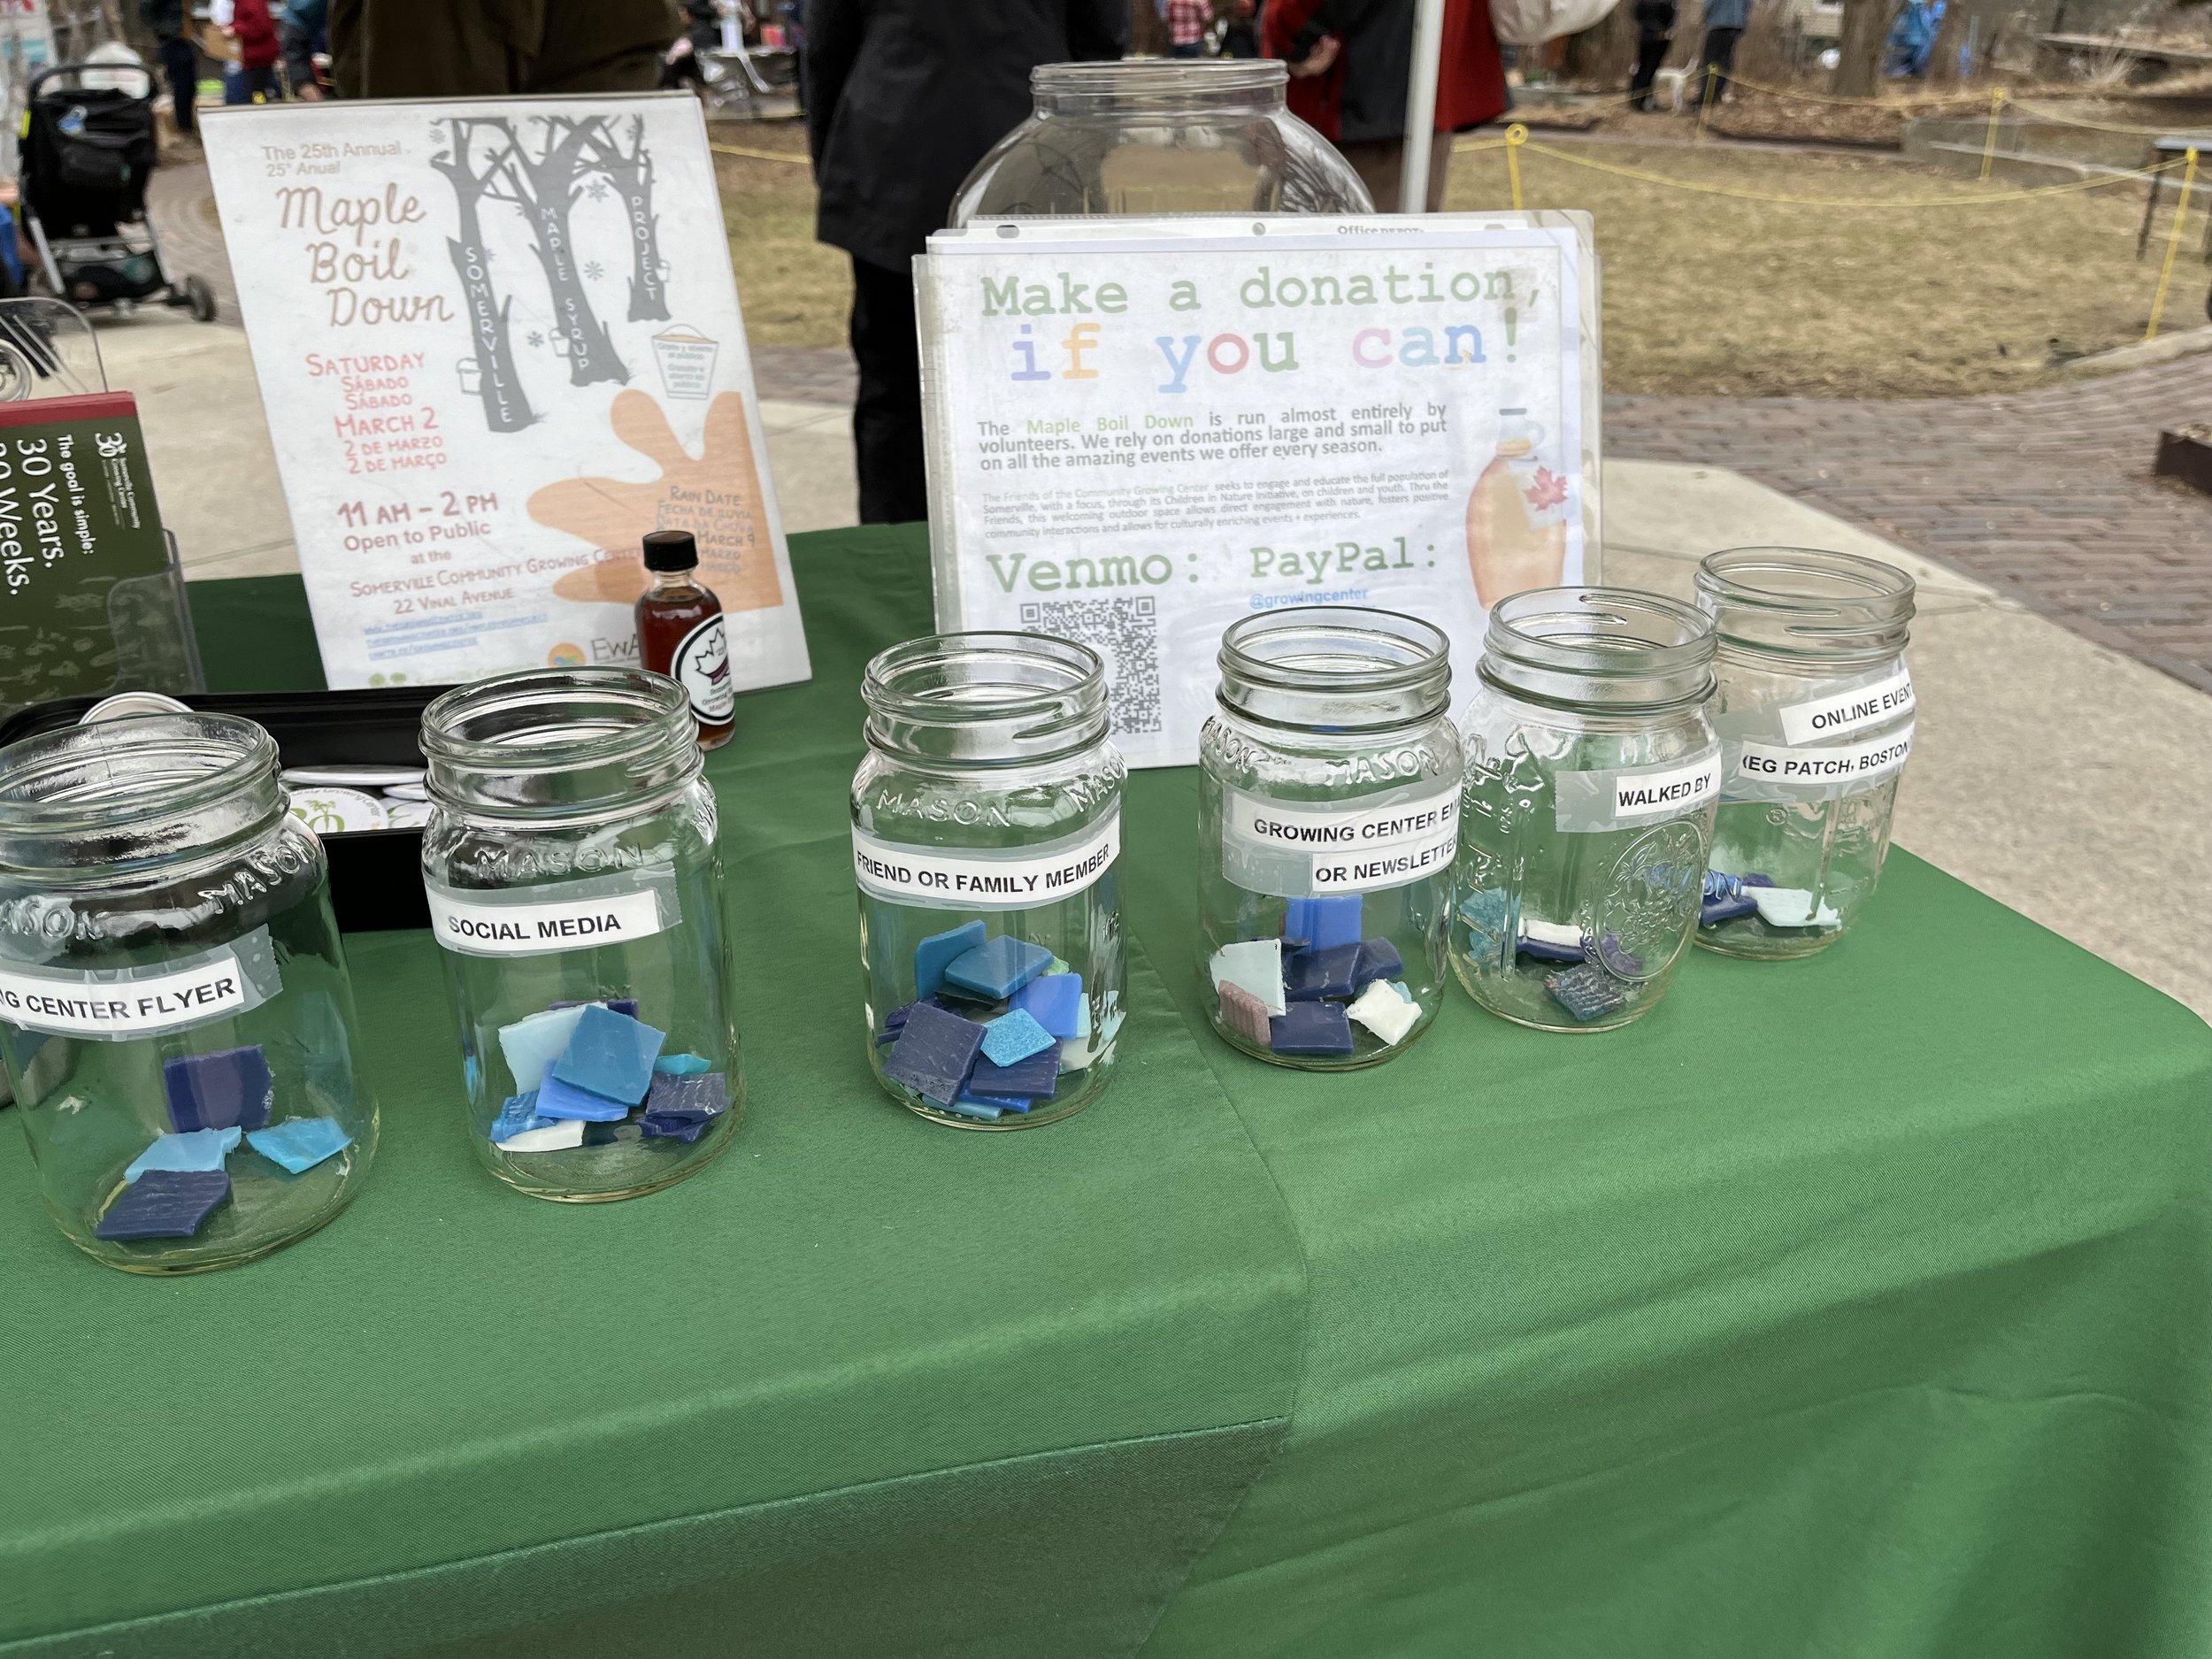
I thought about the event, and all the hands-on activities that were planned (e.g., getting to touch and use some of the kinds of tools involved in tapping sap), and I wondered if we could use a physical survey. We quickly identified outreach categories/responses, and the team made jars for each category. As parties entered the event, volunteers gave them each a small tile, which attendees placed in a relevant jar, before engaging in other activities. As a result, we got 410 responses! (out of around 620 attendees, but for instance, my friend’s 6-month-old baby didn’t answer). We learned that friends and family/word of mouth was the most powerful source, followed by online event listings and social media. It was easy, hands-on, and an approach that matched the flow and vibe of the day. We’re excited to use this approach again.
By the way, the Growing Center is celebrating its 30th anniversary right now. If you like their mission, and feel so inspired, please donate $30 (or any amount) here.
Also, I will love to hear about any ways you use data physicalization. Reach out if you want to get crafty and make something together.
Happy Spring!
Our physicalized survey with some responses early in the day
